P2-4.2 Rate of Change and Slope
Section ID:
P2-4.2Version:v2026.09.14
An output increase of 10 alone does not tell us whether change is rapid. An output increase of 10 while the input increases by 1 differs from the same increase while the input increases by 100. A rate of change compares output change divided by input change. Average velocity in the preceding section was also a rate: change in position divided by change in time.
Why Divide the Changes?
Suppose daily water use increases by 20 liters. A facility with two additional users differs from one with ten additional users in the change in water use per additional user.
| Facility | Additional users | Increase in water use | Average rate |
|---|---|---|---|
| A | 2 | 20 L | 20/2=10 L/person |
| B | 10 | 20 L | 20/10=2 L/person |
The output changes are identical, but A's average rate is five times B's. This compares two observed states; it does not mean every additional user actually used that amount of water.
For a function with input x and output y=f(x), write the changes as Δx and Δy. The delta symbol Δ denotes the later value minus the earlier value.
The numerator and denominator must subtract the same two states in the same order. Reversing both subtractions preserves the ratio, but reversing only one changes its sign. The ratio cannot be calculated when the input change is zero.
A Line: The Same Slope on Every Interval
With input on the horizontal axis and output on the vertical axis, the slope of the line joining two points is vertical change ÷ horizontal change. Compare intervals on this line.
| Input interval | Output change | Input change | Slope |
|---|---|---|---|
| 0 → 1 | 3−1=2 | 1−0=1 | 2 |
| 2 → 3 | 7−5=2 | 3−2=1 | 2 |
| 0 → 3 | 7−1=6 | 3−0=3 | 2 |
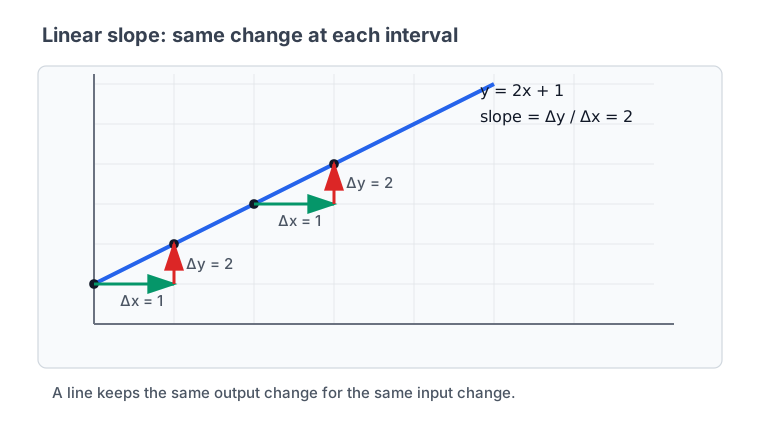
Changing the location or width of the interval leaves the slope at 2. The constant term +1 shifts the graph upward but cancels when subtracting output values, so it does not change the slope. Since Δy=2Δx on this line, increasing the input by 0.5 increases the output by 1.
The Sign and Units of Slope
The sign of the slope tells us which way the output changes when the input increases. Its magnitude tells us how much the output changes for the same input change.
| Line | Slope | When the input increases by 1 |
|---|---|---|
y=2x+1 | 2 | Output increases by 2 |
y=5 | 0 | Output stays the same |
y=−3x+7 | −3 | Output decreases by 3 |
A line with slope zero has the same output everywhere. A zero slope at one point on a curve does not imply constant output nearby. For example, y=x² has tangent slope zero at x=0, but its output at x=1 is 1.
Units must also match when comparing rates. 10 L/person is the same rate as 0.01 m³/person. The numbers differ by a factor of a thousand only because liters and cubic meters are different units. Changing horizontal or vertical tick spacing can also make a graph look steeper, so do not judge slope by its apparent angle alone.
A Curve: Different Average Rates on Different Intervals
For y=x², which represented the motion in the preceding section, average rate varies with the input interval.
| Input interval | Output change | Input change | Average rate |
|---|---|---|---|
| 0 → 1 | 1−0=1 | 1 | 1 |
| 2 → 3 | 9−4=5 | 1 | 5 |
| 1 → 3 | 9−1=8 | 2 | 4 |
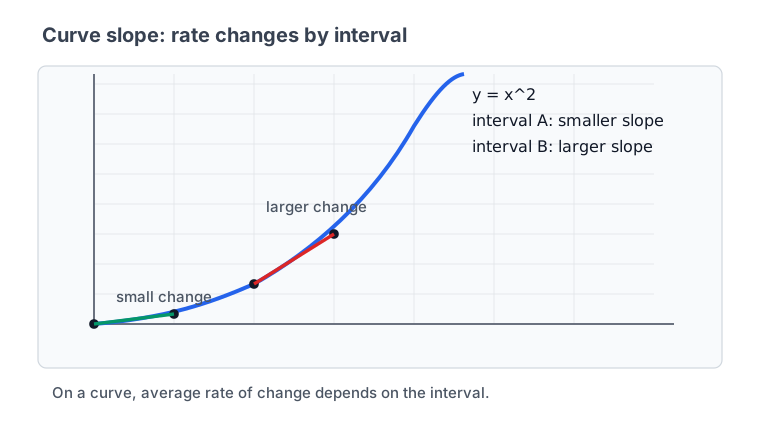
The colored dashed lines are secants joining the endpoints of each interval. The average rates in the table are their slopes, not the slopes at every point on the curve. The average rate of 4 over 1 → 3 likewise summarizes that interval with a single ratio.
The instantaneous rate at a point is the finite value approached by average rates as the interval shrinks toward that point. In the preceding section, shrinking intervals on both sides of x=2 gave 4. An average rate belongs to an interval; an instantaneous rate belongs to a point. If the rates do not converge to one finite value as the interval shrinks, an ordinary derivative cannot be defined at that point.
Reading an Adjustment Direction from Loss Slope
A model's loss measures how far its predictions are from the desired results. Treating one parameter as input and loss as output lets us consider the slope of loss with respect to that parameter. If there are multiple parameters, hold the others fixed and change only one.
If the slope is positive, a sufficiently small increase in that parameter increases loss, while a sufficiently small decrease reduces it. A negative slope reverses these directions. This concerns changes near the current point; it does not guarantee that a large change will reduce loss.
A zero slope does not necessarily mean we have found the lowest loss. Slope informs us about the current direction of change; judging a minimum also requires examining nearby losses. The next section connects rates for multiple parameters through the gradient.
Subscriber Changes Across Advertising-Spend Intervals
The following records were constructed to compare advertising spend and subscriber counts.
| Week | Advertising spend | Subscribers |
|---|---|---|
| 1 | KRW 1,000,000 | 50 |
| 2 | KRW 2,000,000 | 60 |
| 3 | KRW 3,000,000 | 62 |
From week 1 to week 2, the average rate is (60−50)/(200−100)=0.1 subscribers per KRW 10,000. From week 2 to week 3, it is (62−60)/(300−200)=0.02 subscribers per KRW 10,000. The denominators express spending in units of KRW 10,000. For the same KRW 1,000,000 increase, the subscriber increase falls from 10 to 2.
Each value is an average rate over its interval. These three records cannot reveal an instantaneous rate at a particular spending level. Other conditions may also change from week to week, so the rates should not be interpreted directly as the causal effect of advertising spend on subscriber growth.
Exercise: Equal Changes and Different Slopes
First, calculate the average rate from week 1 to week 3 in the advertising example. Second, distinguish output change from average rate for y=−3x+7 as x changes from 1 to 3. Third, calculate how the number and unit in the first answer change when spending is expressed in individual won.
Calculation and explanation
From week 1 to week 3, the rate is (62−50)/(300−100)=0.06 subscribers per KRW 10,000. For the line, output changes from 4 to −2, so the change is −6 and the average rate is −6/2=−3. Expressed in won, the advertising rate is 12/2,000,000=0.000006 subscribers per KRW. The numbers differ because the units differ, but they describe the same rate.
Checklist
- Can you explain why equal output changes can have different rates when input changes differ?
- Can you calculate
ΔxandΔyfrom the same two states in the same order? - Can you check a line's slope using intervals with different locations or widths?
- Can you distinguish a negative change from a negative rate of change?
- Can you explain why numbers and apparent steepness cannot be compared directly when units or graph scales differ?
- Can you distinguish the slope of a secant from the tangent slope at a point?
Sources and References
- OpenStax, Calculus Volume 1, 3.1 Defining the Derivative, source for secants, tangents, and average and instantaneous rates. Accessed: 2026-09-14. Numerical examples and diagrams generated from function values were constructed for this section.