P2-5.3 Sample, Estimation, and Error
Section ID:
P2-5.3Version:v2026.09.15
If we cannot examine records for every user, we estimate the overall mean from some users’ records. The observed subset is the sample, and the whole we want to understand is the population. Changing the sample or using a biased collection method can change the estimate.
| Term | English | Core question |
|---|---|---|
| population | population | What is the whole we want to know? |
| sample | sample | What is the part we actually observed? |
| estimation | estimation | How do we guess a value about the whole from the part? |
| error | error | How far might that guess be from reality? |
The Population of Interest
The population is the whole target we want to know about.
For example, consider the following questions.
- What is the average usage time of all users of a certain service?
- What is the average math score of all high school students in the country?
- What is the repurchase rate among all buyers of a certain product?
- What proportion of all real-world incoming images contain pedestrians?
In these questions, the entire target of interest is the population. All users, all high school students in the country, all buyers, and all real-world incoming images can each become a population.
The problem is that we often cannot observe the whole population. The cost may be too high, it may take too long, the data may belong to the future and not exist yet, or the real world may keep changing.
So we need a sample.
The Observed Sample
A sample is the part actually observed from the population. For example, logs from 10,000 users out of all users, 2,000 survey participants out of all high school students in the country, buyers who answered a survey out of all buyers, and a collected bundle of training images out of real-world images can all be examples of samples.
A sample is not the whole. If the sample represents the population well, that sample becomes a basis for estimating the properties of the whole.
The diagram below first shows the containment relationship between population and sample. A sample is not a separate world standing beside the population. It is the part actually observed from the population. A dataset can be seen as the result of organizing that observed sample into files, tables, or records.
flowchart TD
  subgraph P["population"]
    direction TB
    P1["full target we want to know"]
    subgraph S["sample"]
      S1["observed subset from the population"]
    end
  end

  S --> D["dataset<br/>organized record of collected samples"]
The most important question when looking at a sample is, "Does this sample represent the whole well?" So you should also examine whether the sample is too small, whether a specific group is included too heavily, whether any group is missing, and whether the collection method caused certain values to drop out.
If the sample does not represent the whole well, the estimate calculated from that sample can become unstable or skewed to one side.
Parameters, Statistics, and Estimates
Estimation is the act of using a sample to calculate a value about the population.
For example, suppose you want to know the average usage time of all users of a service, but you cannot see all users. Instead, you draw logs from 10,000 users as a sample and compute the average. In that case, the value you want to know in the population is the average usage time of all users, the data you actually have is the usage time of the sampled 10,000 users, and estimation means using the sample mean to guess the population mean.
In statistics, the actual property of a population is often called a parameter, and the value calculated from a sample is often called a statistic.
| Category | English | Working explanation |
|---|---|---|
| parameter | parameter | the actual property of the whole population |
| statistic | statistic | a value calculated from the sample |
| estimate | estimate | a value calculated to guess the parameter |
Model parameters in AI use the same English word. A statistical parameter describes an actual property of the population, while a model parameter is a number adjusted through learning.
Estimation Error
Here, estimation error is calculated as estimate − true value. If the true population mean is 50 minutes and the sample mean is 47 minutes, the error is 47 − 50 = −3 minutes. A negative value means underestimation; a positive value means overestimation.
In the real world, we often do not know the true overall value. So we cannot always know the error exactly. But we still have to acknowledge that error may exist.
The chart below shows the flow of viewing the difference between the estimate and the true value as error.
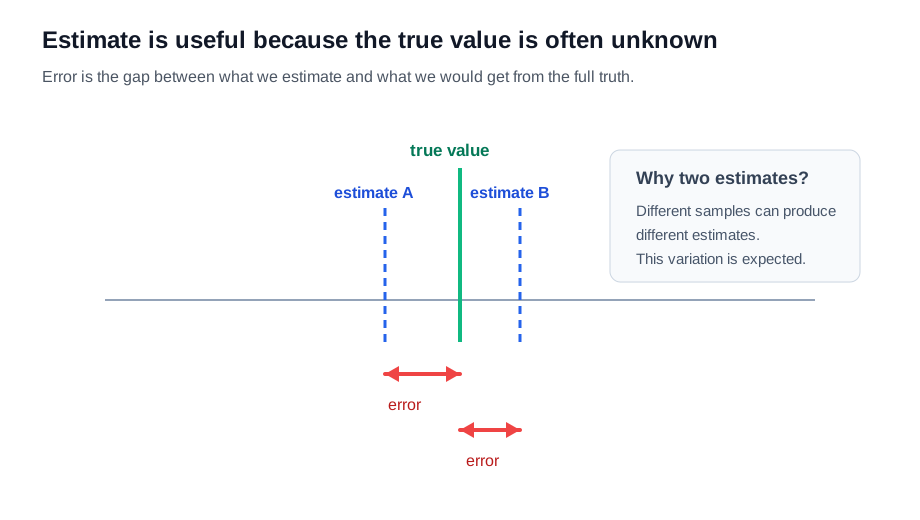
It is a mistake to understand error only as "failure." In statistics, error is the language that acknowledges the unavoidable gap that appears when we talk about the whole from the part. In other words, as long as we estimate from a sample, we cannot know the whole perfectly, a gap may appear, and we treat that gap as error.
The prediction error of an AI model can be viewed from a similar perspective. If the model's prediction and the actual value differ, error appears. In training, we transform this error into loss and try to reduce it.
Sampling Variation
Consider a small population of five users whose usage times are 40, 44, 50, 56, 60 minutes. The population mean is (40 + 44 + 50 + 56 + 60) / 5 = 50 minutes.
Each time, select two distinct users from the five with equal probability and calculate their mean. Three possible samples give the following comparison.
| Sample | Observed usage times | Sample mean | Estimation error: sample mean − 50 |
|---|---|---|---|
| A | 44, 50 minutes | (44 + 50) / 2 = 47 minutes | −3 minutes |
| B | 50, 56 minutes | (50 + 56) / 2 = 53 minutes | +3 minutes |
| C | 40, 60 minutes | (40 + 60) / 2 = 50 minutes | 0 minutes |
The population and sampling rule are unchanged, but selecting different users changes the sample mean. This is sampling variation. A's low mean alone does not establish bias in the collection method. A sample can also happen to have the same mean as the population, as C does.
The table contains calculations for three possible samples, not the complete probability distribution of estimates. The fact that estimates can change with the sample also applies when the true population mean is unknown.
Different test samples can likewise produce different model evaluation scores. To examine this variation, hold the model and evaluation criteria fixed and compare scores across different evaluation samples. Simply rerunning the same model deterministically on the same data does not reveal sampling variation.
Collection Methods and Sampling Bias
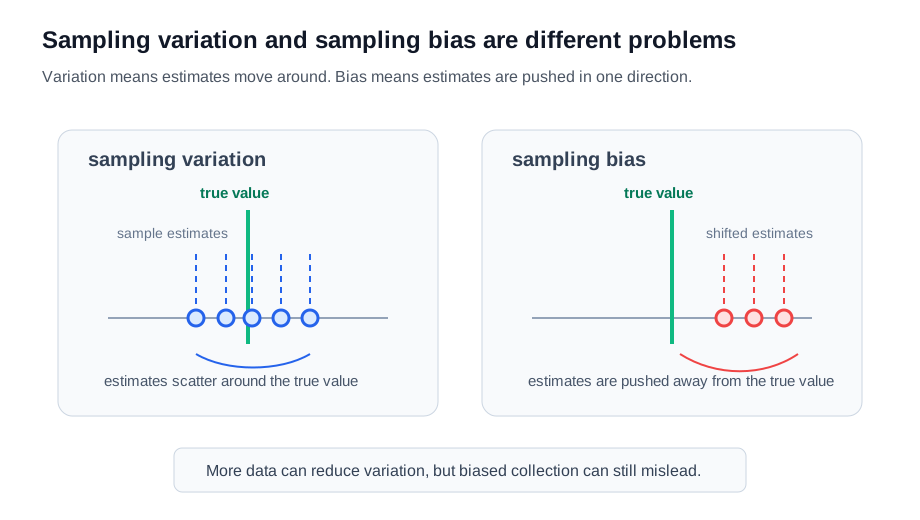
We need to distinguish natural fluctuation caused by a changing sample from the problem where the sample is skewed from the start.
Sampling bias occurs when a collection method systematically overincludes or omits certain groups or values, pushing estimates in one direction. A random sample whose composition happens to differ from the population does not, by itself, establish collection bias. For example, if only younger users were heavily collected, if data from only one region was gathered, if only people who responded were included in survey data, or if only successful cases remained in the logs, then you should suspect sampling bias.
If you estimate the whole from such a sample, the result can become systematically distorted. Random variation is the natural fluctuation that appears when drawing samples, while sampling bias is a problem skewed in a particular direction because of the collection method.
In AI, sampling bias is very important. If training data is skewed toward a certain group, situation, language, or device environment, the model can also become skewed in that direction.
Sampling variation and sampling bias both shake estimation, but their character is different.
| Category | English | Meaning | Response perspective |
|---|---|---|---|
| sampling variation | sampling variation | natural fluctuation that appears when drawing samples | more samples, repeated evaluation, checking variability |
| sampling bias | sampling bias | a problem where the sample is skewed because of the collection method | inspect the collection process, check missing groups, review data composition |
Dataset Collection Conditions
A dataset does not simply mean "a lot of data collected." In AI training contexts, it usually means a bundle that organizes collected samples so a model can read them. In other words, once we observe reality, record the needed fields, and organize them into files, tables, image folders, or label files, they become a dataset usable for training or evaluation.
A dataset is not the whole of reality. A dataset is affected by the time of collection, the collection method, the recording format, the cleaning standard, and the labeling standard. So when you look at a dataset, you should ask together what is being treated as the population, how the sample was collected, whether there are missing groups or situations, what standard the labels follow, and how the data for training and the data for evaluation were separated.
Training Data and Generalization
AI training data is not the whole of reality. It is a sample collected from reality. For example, the total behavior of all real-world users is closer to the population, the collected log data is the sample, and the training dataset is the sample the model actually sees.
So even if the model shows good performance on training data, you cannot immediately say it will always work well across the whole real world. Performing well on training data means it works well on that sample, and whether it also works well on new real-world data must be checked separately.
Generalization is the ability to perform well on new data that was not used for training.
The diagram below shows the flow in which part of the real world is collected into a dataset, and that dataset is then divided again into training data and test data.
flowchart TD
  A["real world<br/>full world we cannot inspect completely"]
  B["dataset<br/>sample collected from reality"]
  C["training data<br/>samples used to learn patterns"]
  D["test data<br/>samples used to estimate performance"]

  A -->|collect| B
  B -->|split| C
  B -->|split| D
Evaluation on a Separate Sample
The reason we keep test data separate when evaluating a model can also be viewed through the perspective of sample and estimation.
A model can show good performance on training data even if it merely memorizes the training data. So we check the model on data that was not used for learning. In other words, the training data is the sample the model learns from, and the test data is a separate sample used to check the model.
Test performance is also an estimate of real-world performance. If the test data is not representative enough, the evaluation result can become unstable or miss real-world performance. A test score is an estimate of real-world performance, and the composition of the test data affects the reliability of that estimate.
Mean Differences Caused by User Composition
Suppose 80% of all users are existing users and 20% are new users. If the two groups have mean usage times of 50 and 20 minutes, the overall mean is:
0.8 × 50 + 0.2 × 20 = 44 minutes
However, if the 10,000 users in the collected logs include 5,000 from each group, the sample mean differs even when the group means remain the same.
(5,000 × 50 + 5,000 × 20) / 10,000 = 35 minutes
| Group | Existing users | New users | Mean usage time |
|---|---|---|---|
| Population | 80% | 20% | 44 minutes |
| Collected sample | 50% | 50% | 35 minutes |
The estimation error in this example is 35 − 44 = −9 minutes. Overrepresenting new users lowers the mean. Expanding the logs to 100,000 users at the same collection ratio does not remove this composition difference. When the collection method causes the difference, inspect group collection ratios and omissions rather than only increasing the sample size.
In real analysis, the population mean is often unknown. This example assumes the population composition and group means are known to calculate how changing only sample composition can change the estimate.
Checklist
- You can explain
populationas the whole target of interest. - You can explain
sampleas the part actually observed from the population. - You can explain
estimationas guessing a value about the population from the sample. - You can distinguish the statistical
parameterfrom themodel parameter. - You can explain
erroras the gap between the estimate and the true value. - You can distinguish
sampling variationfromsampling bias. - You can explain
training dataandtest dataas samples of the whole real world. - You can read model evaluation scores carefully as estimates of real-world performance.
- You can explain a dataset again by separating population and sample instead of treating it as the whole of reality.
Sources and References
- Barbara Illowsky, Susan Dean, Introductory Statistics, 1.2 Data, Sampling, and Variation in Data and Sampling, OpenStax, checked 2026-07-20. Used to confirm that samples are used when gathering information about an entire population is too costly or nearly impossible, and that a sample should share the characteristics of the population it represents.
- Barbara Illowsky, Susan Dean, Introductory Statistics, 7 Introduction, OpenStax, checked 2026-07-20. Used to confirm the context in which repeated sample means are read by their center and spread and connect to the central limit theorem.
- Barbara Illowsky, Susan Dean, Introductory Statistics, 7.1 The Central Limit Theorem for Sample Means, OpenStax, checked 2026-07-20. Used as support for sample-mean sampling distributions, standard error, and how far sample means tend to fall from a population mean in repeated samples.