P2-5.5 Supplementary Learning: Reading Standard Deviation, Correlation, and Confidence Intervals
Section ID:
P2-5.5Version:v2026.09.15
The ± value beside a mean may denote a standard deviation, a standard error, or a confidence interval’s half-width. Standard deviation describes data spread; standard error and confidence intervals describe uncertainty in estimation. Correlation coefficients describe relationships between variables, while hypothesis testing examines how well observations agree with a particular assumption.
What Each Statistic Describes
| Term | What it describes |
|---|---|
| Standard deviation | Spread of data values |
| Covariance | Direction in which two variables’ deviations change together |
| Pearson correlation coefficient | Direction and strength of a linear relationship between two variables |
| Standard error | How much an estimate varies across samples |
| Confidence interval | An interval estimate of a parameter calculated using a specified method |
| Hypothesis testing | A procedure for deciding whether there is evidence to reject a null hypothesis |
Standard Deviation and Original Units
Standard deviation is the square root of variance. If response-time variance is 100 seconds², standard deviation is √100 = 10 seconds. This expresses the same spread information in the original data units.
A mean of 50 seconds and standard deviation of 10 seconds does not mean that all response times lie between 40 and 60 seconds. Check the data distribution to determine how many values fall within that interval.
Products of Deviations and Covariance
Covariance summarizes products of deviations, each obtained by subtracting a variable’s mean. The product is positive when both deviations have the same sign and negative when their signs differ.
| Observation | x | y | x deviation | y deviation | Product of deviations |
|---|---|---|---|---|---|
| 1 | −1 | 2 | −1 | −2 | 2 |
| 2 | 0 | 4 | 0 | 0 | 0 |
| 3 | 1 | 6 | 1 | 2 | 2 |
The mean of x is 0, and the mean of y is 4. Sample covariance is 2: the sum of the products, 4, divided by n − 1 = 2. Here, y increases with x, producing positive covariance.
Covariance depends on units. Expressing y in centimeters instead of meters gives 200, 400, 600 and changes the sample covariance to 200. The relationship is unchanged, but the number is 100 times larger.
Pearson Correlation and Linear Relationships
The Pearson correlation coefficient divides covariance by the product of the two variables’ standard deviations to remove the influence of units. It can be calculated when both standard deviations are greater than zero and ranges from −1 to 1.
For the preceding data, the sample standard deviations of x and y are 1 and 2. The correlation coefficient is therefore 2 / (1 × 2) = 1. Converting y to centimeters leaves it unchanged: 200 / (1 × 200) = 1.
| Pearson correlation coefficient | Interpretation |
|---|---|
| 1 | An increasing straight-line relationship |
| −1 | A decreasing straight-line relationship |
| Close to 0 | A weak linear relationship |
A zero correlation coefficient does not rule out a curved relationship. For example, x = −1, 0, 1 and y = 1, 0, 1 follow y = x², but their Pearson correlation is 0. A strong correlation alone also does not establish that one variable causes the other.
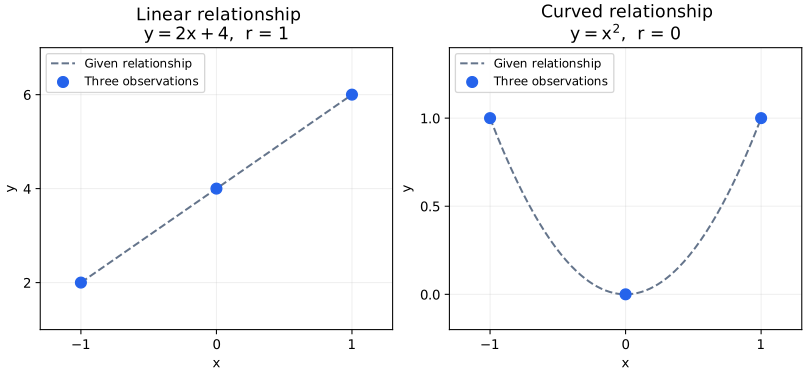
The points are the three observed pairs in the text, and the dashed lines show the given relationships. On the left, the points lie on the increasing line y=2x+4, giving correlation 1. On the right, they lie on y=x², but the products of deviations for negative and positive x cancel, giving correlation 0. These values summarize the three observations; a small sample’s correlation alone cannot establish the population relationship.
Standard Deviation and Standard Error
Standard error is the standard deviation of an estimate’s sampling distribution. It describes how much an estimate, such as a sample mean, can vary when samples are drawn repeatedly using the same method.
One sample contains multiple individual response times. If we repeatedly draw samples of the same size and calculate each mean, we obtain multiple mean values instead. Standard deviation describes the spread of individual values; the standard error of the mean describes the spread of means across repeated samples. We do not have to run many surveys to calculate a standard error. The formula below estimates that spread from one sample.
For a mean estimated from independent observations drawn from the same population, the standard error is estimated as s / √n, using sample standard deviation s and sample size n.
With 100 observations and a sample standard deviation of 10 seconds, the estimated standard error of the mean is 10 / √100 = 1 second. With 400 observations and the same standard deviation, it is 10 / √400 = 0.5 seconds. A larger sample can estimate the mean more precisely even when the data spread stays the same.
The following theoretical comparison assumes a normal population with mean 50 seconds and standard deviation 10 seconds. The upper panel shows individual response times; the lower panel shows the distribution of means computed from 100 independent observations each. Because the population standard deviation is known here, the standard error of the mean is exactly 10/√100=1 second.
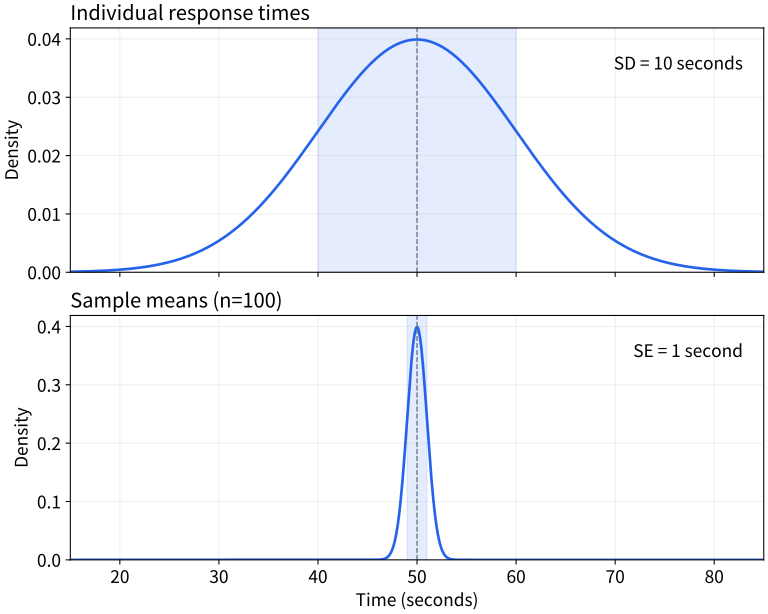
Both horizontal axes measure seconds; the vertical axes show each distribution’s probability density. Shading marks one standard deviation of each distribution on either side of its mean. A narrower distribution of means does not mean individual response times have become more similar. An average of 100 observations varies less than a single response time. This hypothetical population mean of 50 seconds is distinct from the observed mean of 53.4 seconds in the confidence-interval calculation below.
A Confidence Interval for the Mean
Suppose 100 independent observations from a normally distributed population have sample mean 53.4 seconds and sample standard deviation 10 seconds. A 95% confidence interval for the population mean can be calculated using the t distribution:
sample mean ± t coefficient × standard error
The degrees of freedom are n − 1 = 99, and the t coefficient for a two-sided 95% interval is approximately 1.984. Here, degrees of freedom determine the t distribution’s shape and the coefficient.
We use the t distribution because the population standard deviation is unknown and is replaced by sample standard deviation s. Its heavier tails than the normal distribution account for uncertainty in estimating the standard deviation. Once the sample mean has been calculated, deviations from it sum to zero. Fixing 99 deviations therefore determines the last one rather than leaving it free, giving 99 degrees of freedom here.
A two-sided 95% interval leaves 95% in the center and splits the remaining 5% into two tails of 2.5% each. For the t distribution with 99 degrees of freedom, the central 95% boundaries are approximately −1.984 and +1.984. The coefficient comes from a cumulative probability table or a statistical tool, not from the observed mean alone.
53.4 ± 1.984 × 1 ≈ [51.42, 55.38] seconds
The 95% refers to the interval-producing method. If sampling and interval calculation were repeated under the same conditions, about 95% of the resulting intervals would contain the population mean in the long run. It does not mean that 95% of individual response times lie within this calculated interval.
In a frequentist confidence interval, the population mean is fixed while the interval changes from sample to sample. We therefore do not interpret the already calculated [51.42,55.38] as having a 95% probability of containing the population mean. The 95% describes coverage when the same method is repeatedly applied.
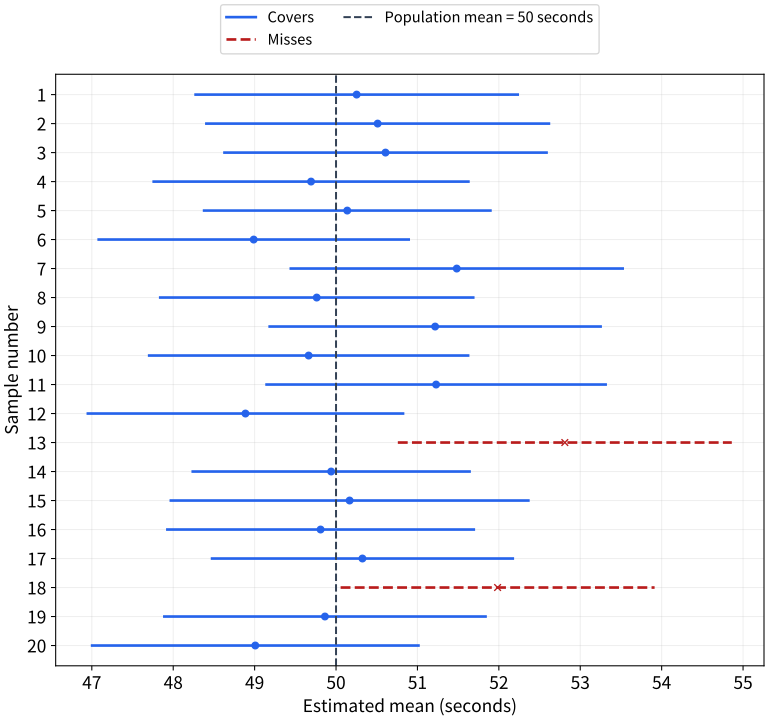
The figure simulates 20 repetitions of drawing 100 independent observations from a normal population with mean 50 seconds and standard deviation 10 seconds. Each point is a sample mean and each segment is its 95% t confidence interval. The vertical dashed line is the population mean known in the simulation. Intervals missing it are red and dashed. In this run, 18 out of 20 intervals covered the population mean. Exactly 19 out of 20 intervals need not cover the mean. The 95% describes a long-run proportion; in a real survey, the true value is unknown, so we usually cannot identify which individual intervals succeeded.
A narrow confidence interval does not mean collection bias is small. For example, collecting records only from devices with fast responses may produce a narrow interval for that group’s mean as sample size grows, while still missing the mean for all devices. The 95% interpretation above applies when sampling reflects the target population and the calculation assumptions hold. The sample-representativeness checks from P2-5.3 remain necessary after calculating a confidence interval.
Null Hypotheses and Hypothesis Testing
Hypothesis testing uses sample data to decide whether there is evidence to reject a null hypothesis. In the response-time example, the null hypothesis can be the population mean is 50 seconds, and the alternative can be it differs from 50 seconds.
A 5% significance level is an error criterion chosen before deciding the conclusion from the data. If the null hypothesis and test assumptions are true, the boundary makes the long-run rate of incorrectly rejecting a true null hypothesis 5%. It does not mean “this conclusion has a 5% probability of being wrong” or “the null hypothesis has a 5% probability of being true.”
The difference between the observed mean of 53.4 seconds and the assumed mean of 50 seconds is 3.4 seconds. Dividing by the standard error of 1 second gives the test statistic t = 3.4. Under the same assumptions, the critical values for a two-sided t test at a 5% significance level are approximately ±1.984, so we reject the null hypothesis.
This is evidence that the observations do not agree well with the assumed population mean of 50 seconds. Whether the difference is practically large requires a separate judgment. Conversely, failing to reject the null hypothesis does not prove equality.
With the same two-sided t method, the 95% confidence interval and the test at a 5% significance level agree. The hypothesized mean of 50 seconds lies outside [51.42,55.38], so the test rejects it. Testing 54 seconds on the same sample gives a value inside the interval and t=(53.4−54)/1=−0.6 inside the critical boundaries, so it is not rejected. This does not make all values in the interval equally plausible or prove that 54 seconds is the true mean.
Different Numbers Beside the Same Mean
The preceding sample can be reported as follows.
| Notation | Interpretation |
|---|---|
| Mean 53.4 seconds, standard deviation 10 seconds | Spread of individual response times |
| Mean 53.4 seconds, standard error 1 second | Variability of the estimated mean |
| Mean 53.4 seconds, 95% confidence interval [51.42, 55.38] seconds | An interval estimate of the population mean using a specified method |
Writing only 53.4 ± 10 does not identify the statistic. When you encounter ± in a table or graph, check the statistic’s name in the legend, the sample size, and the measurement units.
Exercise: Distinguish Spread from Estimation
First, calculate the standard error of the mean for sample size 400 and sample standard deviation 10 seconds. Second, explain whether mean 53.4 seconds ± 0.5 seconds alone identifies a 95% confidence interval. Third, explain whether correlation 0 for x=−1,0,1 and y=1,0,1 permits a conclusion of no relationship.
Calculation and Explanation
The estimated standard error of the mean is 10/√400=0.5 seconds. The standard deviation of 10 seconds has not shrunk to 0.5 seconds. Without a statistic name, ±0.5 seconds does not specify the interval’s meaning; a 95% t confidence interval’s half-width requires multiplying the standard error by a t coefficient. The last data follow the curved relationship y=x², so Pearson correlation 0 does not imply no relationship.
Checklist
- You can calculate a standard deviation of 10 seconds from a variance of 100 seconds².
- You can explain that covariance changes with measurement units.
- You can explain that Pearson correlation describes a linear relationship and does not prove causation.
- You can distinguish the data’s standard deviation from the mean’s standard error.
- You can explain the repeated-sampling meaning of a 95% confidence interval.
- You can distinguish rejecting a null hypothesis from the practical importance of a difference.
- You can read
±notation together with the name of the statistic.
Sources and References
- Barbara Illowsky, Susan Dean, Introductory Statistics, 2.7 Measures of the Spread of the Data, OpenStax, checked 2026-07-20. Used to explain standard deviation as the square root of variance, in the original data units.
- NIST/SEMATECH, Dataplot Reference: CORRELATION, NIST, checked 2026-09-15. Used for the products of deviations \(S_{xy}\) and the correlation formula, supporting the interpretation of joint variation and correlation.
- Barbara Illowsky, Susan Dean, Introductory Statistics, 7.1 The Central Limit Theorem for Sample Means, OpenStax, checked 2026-07-20. Used for the sampling distribution of sample means and standard error across repeated samples.
- Barbara Illowsky, Susan Dean, Introductory Statistics, 8 Introduction, OpenStax, checked 2026-07-20. Used for point and interval estimation, confidence intervals, and margins of error.
- Barbara Illowsky, Susan Dean, Introductory Statistics, 9 Introduction, OpenStax, checked 2026-07-20. Used for evaluating sample evidence to decide whether to reject a null hypothesis.
- Barbara Illowsky, Susan Dean, Introductory Statistics 2e, 12.4 Testing the Significance of the Correlation Coefficient, OpenStax, checked 2026-07-20. Used for the strength and direction of a linear relationship and the need to consider sample size when assessing correlation.
- NIST/SEMATECH, Confidence Limits for the Mean, checked 2026-09-15. Source for t confidence intervals for a mean, their repeated-sampling interpretation, and the one-sample t test. The numerical example was constructed for explanation.