P2-9.2 The Intuition of Arrays, Tables, Trees, and Graphs
Section ID:
P2-9.2Version:v2026.07.23
In P2-9.1, we viewed a data structure as a question of how data is organized into a shape. Now we compare broadly four shapes that appear often in AI practice.
Arrays, tables, trees, and graphs.
This Section provides a basic explanation that compares array, table, tree, and graph all at once. Even if the next Section looks separately at graphs in more detail, the standard for reconnecting how these four structures answer different questions is set here.
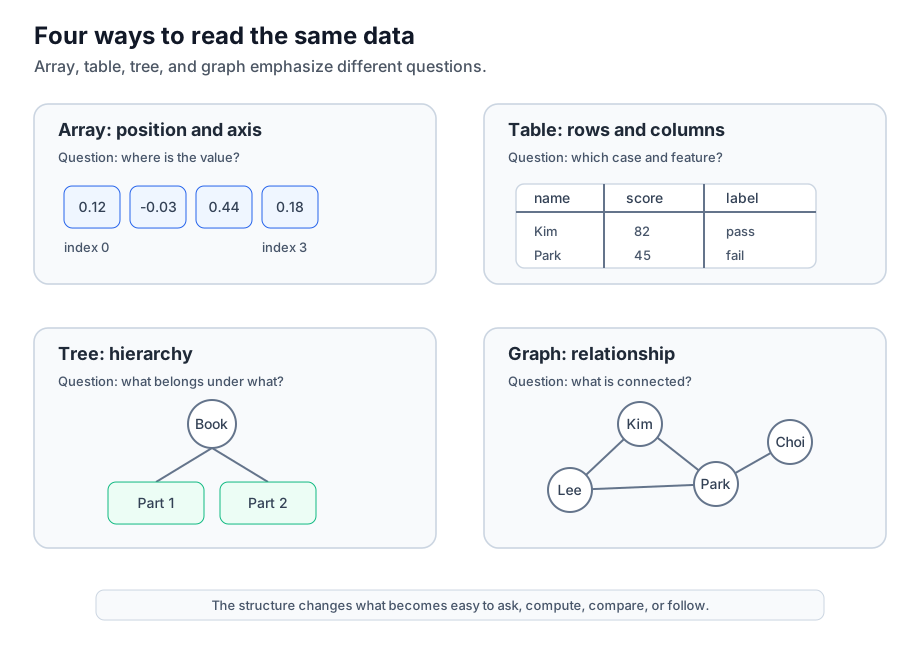
All four are ways of holding data, but they answer different questions. Arrays ask about position and axis. Tables ask about rows and columns. Trees ask about hierarchy. Graphs ask about relations.
Instead of memorizing all data-structure names at once, this Section compares which questions naturally call for which structures. If the previous Section provided the big picture of why data structures are needed, this Section unfolds that picture into four representative views: array, table, tree, and graph. If you capture this distinction first, then even when NumPy and Pandas appear again later, it becomes easier to think first about which structural question is being asked rather than which tool name is in front of you.
| What to capture in this Section now | The question that follows immediately next | Where it appears again later |
|---|---|---|
| The point that arrays, tables, trees, and graphs are structures answering different questions | It leads to why P2-9.3 looks separately again at graphs, where relationship representation matters especially | It repeats later in explanations of NumPy, Pandas, document structure, and relational data |
| The point that even the same data can be read in different structures depending on whether you look at position, comparison, hierarchy, or relation | It leads to the criterion for deciding which structure is more natural for the current task | It is used again later in dataset design, preprocessing, search, recommendation, and knowledge-graph explanations |
| The point that Chapter 9 trains structural choice questions rather than name memorization | It leads to a safer standard for reading the traditional term list in the P2-9.4 supplement | It becomes the basis for not mixing data-structure terms and actual practice scenes later |
| Term | Meaning to capture first in this Section |
|---|---|
| array | A structure that reads values by position and axis |
| table | A structure that organizes values by intersections of rows and columns |
| tree | A structure read mainly through parent-child hierarchy |
| graph | A structure read mainly through nodes and connections |
| structure question | A question asking which matters in the current data: position, row-column layout, hierarchy, or relation |
Core Criteria: The Intuition of Arrays, Tables, Trees, and Graphs
- You can distinguish arrays, tables, trees, and graphs as different views of data.
- You can explain arrays through position and axis, tables through rows and columns, trees through parent-child relations, and graphs through nodes and edges.
- You can explain which structural intuition connects to tokens, embeddings, datasets, document structure, and knowledge graphs in AI practice.
- You can explain that the same information can be viewed as an array, table, tree, or graph depending on the purpose.
The First Standard to Hold
The first standard to hold in this Section is not the name of the data structure, but what question is being asked right now.
| Question being asked now | Structure to recall first |
|---|---|
| Which position's value is this? | array |
| Which row and column does this value belong to? | table |
| How are higher and lower levels divided? | tree |
| What is connected to what? | graph |
In other words, even with the same data, the more natural structure changes depending on whether you are looking at position, row-column layout, hierarchy, or relation.
Three Criteria
| Criterion | Why it matters | Level of understanding needed in this Section |
|---|---|---|
| Why the same data can be seen through multiple structures | Because when the question changes, the structure that reveals it well also changes | It is enough to understand that the same information can be read differently depending on whether you look at position, comparison, hierarchy, or relation |
| The difference among arrays, tables, trees, and graphs | It lets you distinguish the four structures by reading standard rather than by name | It is enough to separate the different viewpoints of position, rows and columns, hierarchy, and connection |
| What to remember first now | It helps you recall the structure question before the tool name later | Remember first which question each structure is strong at, before the name of the data structure |
Comparing Four Structures at Once
When seeing a data structure for the first time, what it asks matters more than the name.
The diagram below shows which question each of the four structures emphasizes.
| Structure | Core question | Basic unit | Example seen in AI practice |
|---|---|---|---|
| array | Which position's value is it? | index, axis, value | vectors, matrices, image pixels, embeddings |
| table | Which row and column does this value belong to? | row, column, cell | CSV datasets, training data, evaluation results |
| tree | How are higher and lower levels divided? | root, parent, child | table of contents, folders, classification systems, decision flow |
| graph | What is connected to what? | node, edge | links, recommendation relations, knowledge graphs, search connections |
These four structures are not completely separated worlds. One column of a table can be computed like an array, a tree can be explained as a special form of graph, and even a graph can be represented simply by combining Python dictionaries and lists.
What matters here is not memorizing the correct structure. It is learning that data looks different depending on what question you ask.
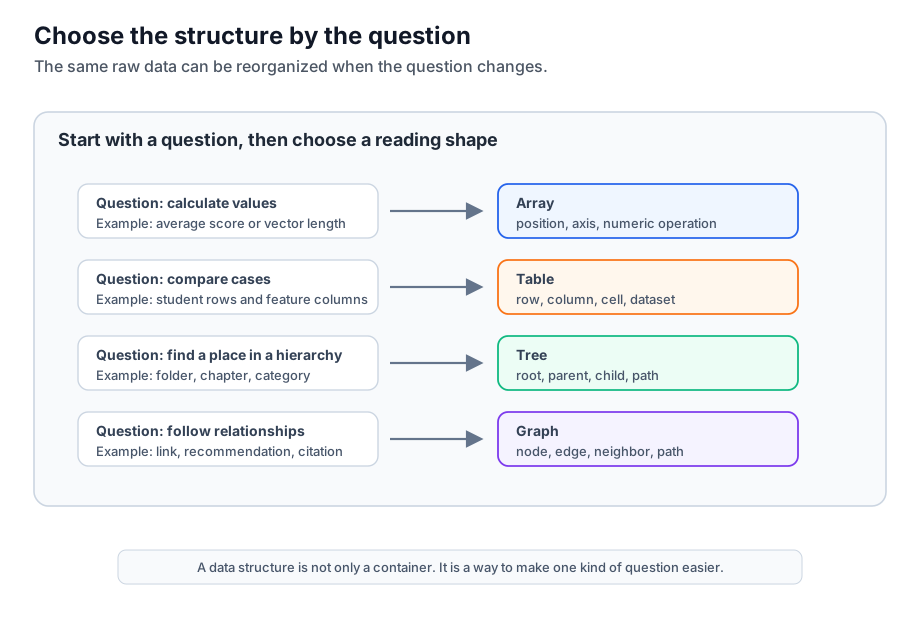
The diagram below organizes again the flow from question to data structure.
Write the question before the name of the data.
| Question to write first | Structure to recall |
|---|---|
| Do we need to compute numbers in order? | array |
| Do we need to compare attributes by case? | table |
| Do we need to see containment between higher and lower levels? | tree |
| Do we need to follow connections among objects? | graph |
If this table is rewritten in a more practical form:
| AI practice scene | Structural intuition to read first |
|---|---|
| embedding vectors, image pixels | array |
| CSV files, training datasets, experiment result tables | table |
| table of contents, folders, classification systems | tree |
| links, recommendation, knowledge relations | graph |
Array: Data Read Through Position and Axis
An array is a structure that handles values by position. NumPy documentation explains ndarray as a multidimensional container holding items of the same type and size. Here, understand an array as follows.
An array is a structure where numbers are placed with positions and axes.
A one-dimensional array is a single line of numbers.
Problem situation: You want to check array intuition for reading values by position using the smallest number list. Input: The number list embedding. Expected output: The first value and the third value are printed. Concept to check: In an array, not only the value itself but also which position the value belongs to matters.
A two-dimensional array can be seen like a grid of numbers with rows and columns.
Problem situation: You want to see an example of taking out values at specific positions from a number grid that looks like a two-dimensional array. Input: A 2-by-3 number structure, image_patch. Expected output: Two values at designated row and column positions. Concept to check: A two-dimensional array reads row and column positions together to find values.
In arrays, not only the value but also position matters. If the positions of image pixels change, it becomes a different image. Embedding vectors too must keep numbers in a fixed order to be used for computation.
In AI practice, array intuition appears often in the following scenes.
- When a sentence is turned into a sequence of token IDs
- When words, sentences, and images are represented as embedding vectors
- When multiple samples are grouped and computed like a matrix
- When image data is handled through the axes of height, width, and channel
An array is close to a structure for numerical computation. That is why it appears again in the NumPy arrays of P2-11, the vectors and matrices of Chapter 3, and the explanations of tensors after Part 4.
For example, to calculate an average score, it is simpler to pull out just the score array than to look at the entire table.
Problem situation: You want to see through an average-calculation example a case where a structure containing only numbers is advantageous for computation. Input: The score list scores. Expected output: The average value average. Concept to check: Array intuition is especially useful in work centered on numerical computation.
In this example, the focus is not on student names or labels but on the positions of numbers and the computation. In moments like this, array intuition is needed first.
Table: Data Read Through Rows and Columns
A table is a structure that reads data by rows and columns. Pandas explains a DataFrame as a two-dimensional, size-mutable, potentially heterogeneous tabular data structure. It also explains that it has labeled axes of rows and columns.
Here, understand a table as follows.
A table is a structure where one case is placed as a row and one attribute is placed as a column.
| name | age | score | label |
|---|---|---|---|
| Kim | 21 | 82 | pass |
| Lee | 20 | 75 | pass |
| Park | 22 | 45 | fail |
In Python, a small table can be represented with lists and dictionaries.
Problem situation: You want to see an example of iterating over data arranged like a table of attributes by case. Input: The list students containing student records. Expected output: Student names and scores are printed in order. Concept to check: A table structure can be read as one row being one case and each key playing the role of a column.
What matters in a table is what one row means and what one column means.
In AI practice, table intuition appears often in the following scenes.
- When reading a CSV file as a dataset
- When separating input features and target labels
- When comparing training results by model or by experiment
- When checking missing values, outliers, and data types
A table is close to a structure for organizing cases and attributes. It can turn into an array when doing numerical computation, but when a person inspects and explains data, a table is often easier to read.
For example, if you want to select only students who passed, a table structure is more natural than a score array.
Problem situation: You want to see an example of condition filtering while looking at multiple attributes of one case together. Input: The student record list students. Expected output: passed_students, which contains only the names of passed students. Concept to check: Table intuition is advantageous when comparing or filtering while looking at multiple attributes together.
In this example, the focus is not only on numerical computation but on the multiple attributes one case has. That is why row-column intuition matters.
Tree: Data Read Through Hierarchy
A tree is a structure that starts from a root and goes down through parent-child relations. The NIST Dictionary of Algorithms and Data Structures explains a tree as a structure accessible from a root node, where internal nodes have one or more child nodes.
Here, understand a tree as follows.
A tree is a hierarchical structure whose scope narrows from top to bottom.
In Python, a small tree can be represented with dictionaries and lists.
Problem situation: You want to see an example of expressing a hierarchy such as a document structure with tree-like data. Input: course_tree, which has a root title and a list of children. Expected output: Each Part title is printed. Concept to check: A tree is a hierarchical structure where lower items appear under higher items.
What matters in a tree is hierarchy and path. It matters which item belongs under which higher item, and from where you start and to where you go down.
In AI practice and services, tree intuition appears in the following scenes.
- When reading document tables of contents and section structure
- When handling folder and file paths
- When making classification systems or categories
- When understanding decision trees
- When reading nested structures such as JSON or HTML
A tree is close to a structure that organizes relations into hierarchy. Not every relation is expressed as a tree, but for data with clear higher and lower levels, tree intuition fits well.
In a tree, you ask, What exists under which item? For example, you take out the Chapter list under a specific Part.
Problem situation: You want to see an example of finding the lower list under a specific higher item in a tree. Input: course_tree and the item to find, "Data Work". Expected output: The list of lower topics under "Data Work". Concept to check: In a tree, the sense of starting from the root and going down to the desired path matters.
In this example, what matters is not the size of values or the columns of a table, but the path. You need the sense of starting from the root and going down to the desired place.
Graph: Data Read Through Connections
A graph expresses connections among objects. NIST explains a graph as a set of items connected by edges, and explains each item as a vertex or node.
Here, understand a graph as follows.
A graph is a structure that expresses relations with points and lines.
In Python, a small graph can be expressed like an adjacency list.
Problem situation: You want to see the simplest example of expressing connections among people as a graph. Input: The friendship dictionary friends. Expected output: The list of people directly connected to "Kim" is printed. Concept to check: A graph is a structure that stores and follows connections between one object and another.
What matters in a graph is connection more than order or hierarchy. It matters who is connected to whom and which paths can be followed.
In AI practice and services, graph intuition appears in the following scenes.
- When following links from one document to another
- When expressing concept relations in a knowledge graph
- When seeing connections between users and items in a recommendation system
- When seeing connections among documents, keywords, and sources in a search system
- When handling relations between document chunks and metadata in RAG
A graph is close to a structure that follows relations. In P2-9.3, we will see graphs in a bit more detail from the viewpoint of nodes and edges.
In a graph, the first question is, What objects are directly connected to this object?
Problem situation: You want to see again an example of checking the neighbors directly connected to one node in a graph. Input: friends["Kim"]. Expected output: The names of friends connected to "Kim". Concept to check: The first question in reading a graph is who the directly connected neighbors are.
Then you move one step further and ask, What becomes visible if we follow the connections? That question is treated in more detail in P2-9.3.
Looking Again at the Same Information Through Four Structures
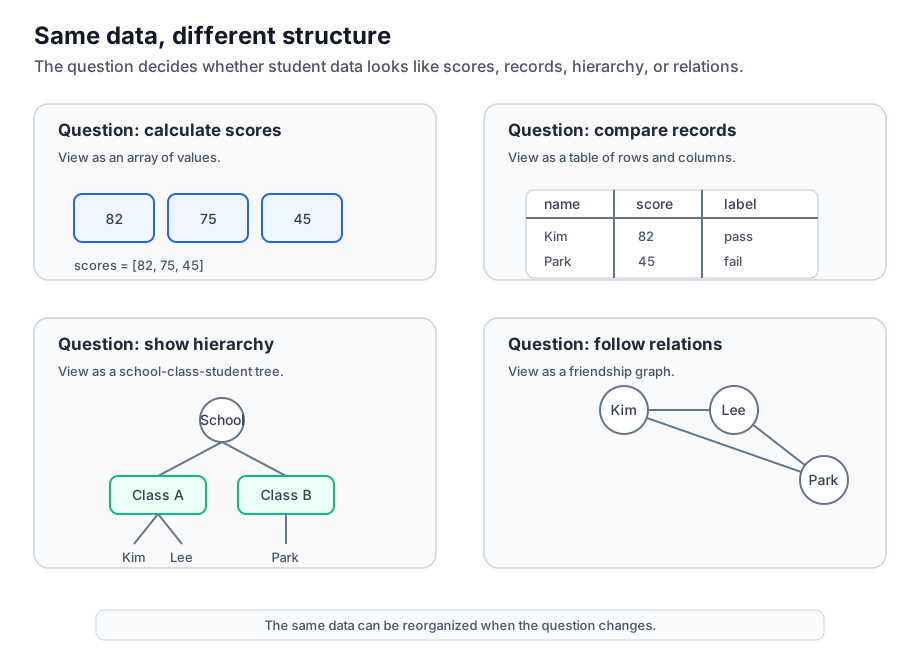
Now let us look again at the same student data from four viewpoints.
The diagram below shows how the same student data can be read as a score array, a record table, a school hierarchy, and a friendship relation.
If you look only at scores in order, it becomes array intuition. If you look at attributes by student in rows and columns, it becomes table intuition. If you look at hierarchy such as school, class, and student, it becomes tree intuition. If you look at friendship relations among students, it becomes graph intuition.
Problem situation: I want to check how the same student records are read differently when the question changes. Input: A student list containing names, classes, scores, labels, and friendship relations. Expected output: An average score from array intuition, pass-list names from table intuition, a class-student hierarchy from tree intuition, and direct friends from graph intuition. Concept to check: The same source data can be reorganized into different structures depending on whether the question is calculation, comparison, hierarchy, or connection.
What matters is not which expression is the correct answer. When the question changes, the structure changes too.
| Question | More natural structure |
|---|---|
| Do you want to compute score numbers? | array |
| Do you want to compare attributes by student? | table |
| Do you want to see the school-class-student hierarchy? | tree |
| Do you want to see relations among students? | graph |
In small practice work, it is helpful to train yourself to transform the same data into multiple structures.
Problem situation: You want to see an example that simultaneously creates array, hierarchical grouping, and graph representation from one source dataset. Input: The student record list students. Expected output: The score array scores, the grouped names by class names_by_class, and the friendship graph friends. Concept to check: The same data can be represented again in multiple structures depending on the question.
This code does not mean that one structure is always the right answer. It is an example showing that from the same source data, you can make a computation array, a hierarchical grouping, and a relation graph.
Changing the Structure Changes What Becomes Visible
Changing a data structure is not merely changing the storage method. It changes which questions become easier to answer.
When viewed as an array, computation becomes easier.
When viewed as a table, comparison and filtering become easier.
When viewed as a tree, hierarchy and containment relations become easier.
When viewed as a graph, connection and path become easier.
In AI practice, these structures can also be transformed into one another. A numeric column from a dataset first read as a table can be turned into an array and fed to a model. Metadata from a document table can also be expanded into graph relations. A document structure that looked like a tree, such as a table of contents, can later be reinterpreted in the search stage as a graph of connected document chunks.
Case Study
Case 1. What changes when the same classroom data is read through four structures?
Suppose there is data containing, all at once, student names, scores, class membership, and friendship relations in one classroom. At first, a person may want to see this data only as a single table.
But when the question changes, the structure that becomes easy to read changes too. When you want to calculate only scores, an array is natural. When comparing attributes by student, a table is convenient. When looking at membership systems such as school-class-student, a tree is appropriate. When following friendship relations, a graph is more direct.
This Section shows exactly that transition. Arrays, tables, trees, and graphs are not competing correct-answer structures. They are viewpoints strong at different questions. Therefore, being able to reread the same source data in multiple ways helps you interpret later AI datasets, embeddings, document structure, and link relations more accurately.
The checkable result is whether the code changes by question. If different expressions become simpler when pulling out only the score list for an average, grouping names by class, or looking at friendship connections, then the meaning of changing structure becomes clear.
Checklist
- Can you distinguish arrays, tables, trees, and graphs in one sentence each?
- Can you explain why the same data can be read through different structures too?
- Can you explain why a CSV file and an embedding vector are not the same structure question?
- Can you explain an array through position, axis, and numerical computation?
- Can you explain a table through rows, columns, and datasets?
- Can you explain a tree through root, parent, child, and hierarchy?
- Can you explain a graph through node, edge, and relation?
- Can you explain that the same data can be viewed as an array, table, tree, or graph depending on the question?
- Can you explain which structural intuition connects to tokens, embeddings, datasets, document structure, and knowledge graphs in AI practice?
- Can you first distinguish whether the current question is about an array, table, hierarchy, or relationship?
Sources and References
- NumPy Developers, The N-dimensional array (
ndarray), NumPy v2.5 Manual, checked on 2026-07-20. Used as the basis for array intuition by confirmingndarraydimensions, shape, dtype, indexing, and slicing. - pandas, pandas.DataFrame, pandas 3.0.4 documentation, checked on 2026-07-20. Used as the basis for explaining a DataFrame as a two-dimensional structure with rows and columns.
- Paul E. Black, tree, Dictionary of Algorithms and Data Structures, NIST, checked on 2026-07-20. Used as the basis for explaining a tree as a hierarchical structure with root and parent-child relationships.
- Paul E. Black, graph, Dictionary of Algorithms and Data Structures, NIST, checked on 2026-07-20. Used as the basis for explaining a graph as a structure that represents relationships with nodes and edges.