P2-9.3 How Does a Graph Represent Relationships?
Section ID:
P2-9.3Version:v2026.09.15
Nodes and Edges
NIST's Dictionary of Algorithms and Data Structures describes a graph as items connected by edges. Each item is called a vertex or node.
A graph represents objects as nodes and relationships between them as edges.
The diagram shows the same graph as a drawing and an adjacency list.
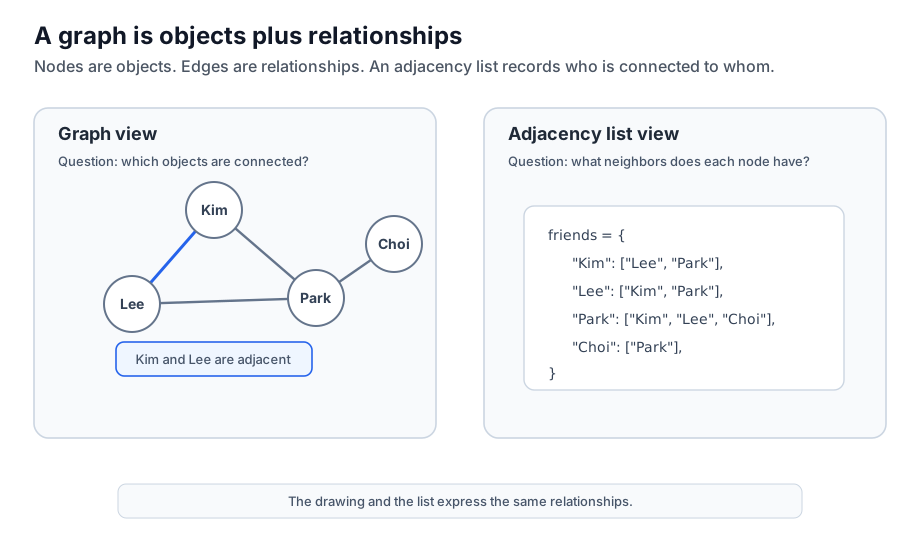
Kim, Lee, Park, and Choi are nodes.
A line joining two nodes, such as Kim -- Lee, is an edge.
The same relationships can be written as neighbor lists for each node.
| Node | Neighbors |
|---|---|
| Kim | Lee, Park |
| Lee | Kim, Park |
| Park | Kim, Lee, Choi |
| Choi | Park |
This is an adjacency-list representation: each node has a list of its connected neighbors.
Relationship Rows and Neighbor Lists
The same friendship data can be stored in a table, with one relationship per row.
| person | friend |
|---|---|
| Kim | Lee |
| Kim | Park |
| Lee | Park |
| Park | Choi |
Questions such as who connects to Kim or whether Choi can be reached through Park naturally call for a graph view.
The diagram contrasts the questions asked of the same records as a table and as a graph.
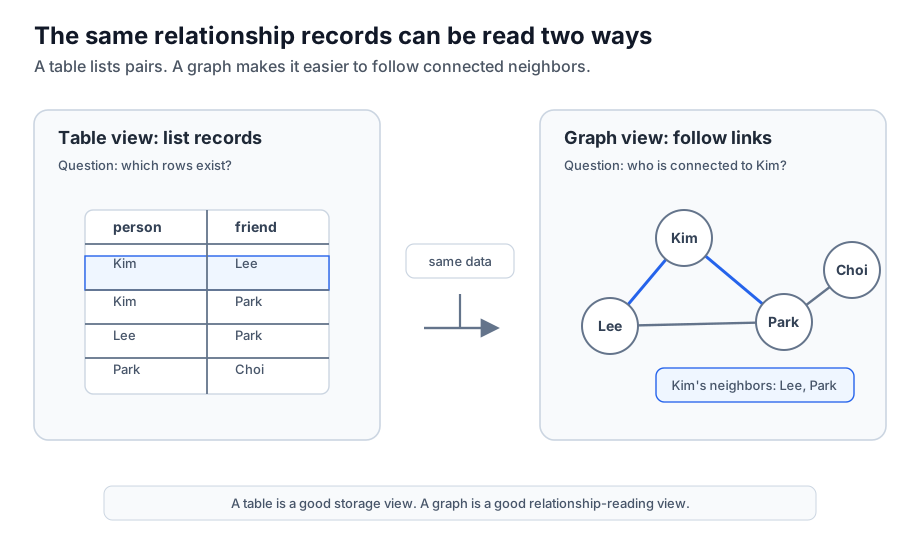
To read the table as a graph, regroup relationship rows into neighbor lists by node.
Querying Neighbors with NetworkX
NetworkX is a Python library for constructing graphs and querying neighbors and paths. This code enters the four friendships above and three page links. Kim's direct neighbors are Lee and Park; Choi has shortest-path distance two. Among page links, page_b points to page_c, with no reverse link.
Expected output:
nx.Graph() creates undirected connections such as friendships; nx.DiGraph() creates directed connections such as web links. neighbors() finds direct neighbors, and single_source_shortest_path_length() counts steps from a starting node. Here weight is an illustrative relationship strength; the step-count function ignores it and counts each edge as one step.
Trees and Cycles
A tree is a special kind of graph. NIST's graph definition also notes this relationship.
The distinction used here is as follows.
An undirected tree is connected and has no cycles. Choosing a root lets it be read as a parent-child hierarchy.
A book's contents usually fit a tree view.
Relationships between people are harder to arrange as a tree.
These friendships contain the cycle Kim → Lee → Park → Kim, returning to the same node. The graph is therefore not a tree.
Edge Direction
Graph edges can be undirected or directed.
Use an undirected graph when a relationship has the same meaning in both directions.
A simplified friendship is written Kim -- Lee: if Kim is Lee's friend, Lee is also Kim's friend.
The connection must be readable from both endpoints in an undirected graph.
| Node | Neighbor |
|---|---|
| Kim | Lee |
| Lee | Kim |
Use a directed graph when orientation matters.
Web links have direction. Document A linking to B does not imply B links to A.
For a directed graph, record outgoing connections.
| Source | Outgoing targets |
|---|---|
| page_a | page_b, page_c |
| page_b | page_c |
| page_c | None |
Direction often matters in AI and search: a document cites another, a workflow moves to a next step, or a user clicks an item. These can be modeled with directed graphs.
The diagram shows how direction and weights change edge meaning.
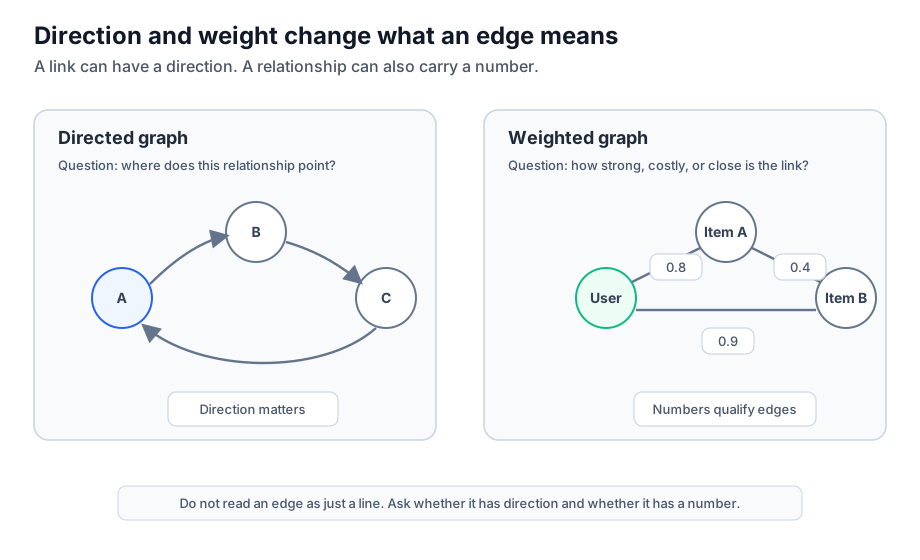
Do not assume a directed relationship also exists in reverse. Read only the recorded direction.
| Question | Answer |
|---|---|
Which page does page_b point to? | page_c |
Does page_c point back to page_b? | No, in this table |
Here page_b links to page_c, but no reverse page_c-to-page_b link is given.
What Weights Mean
Connections need not have equal strength. Some relationships are close, others distant, and some are costly.
A number attached to an edge is called a weight.
Suppose travel between A, B, and C has these illustrative costs. They are comparison values, not real geographical distances.
| From | To | Weight |
|---|---|---|
| A | B | 160 |
| A | C | 325 |
| B | C | 200 |
A direct A–C trip costs 325, while traveling through B costs 160 + 200 = 360. Minimum cost chooses the direct edge. Changing A–C to 400 makes the route through B cheaper.
If weights represent similarity, larger values may mean closer relationships. Whether larger or smaller is better depends on what the number means.
Weights extend questions beyond whether nodes connect to how close, costly, or strongly related they are.
The same reasoning applies to scores for search or recommendation candidates. The following example compares already-computed relationship scores against a threshold.
| Candidate | Query relationship score | Compared with 0.7 | Interpretation |
|---|---|---|---|
doc_a | 0.91 | At or above | Strong candidate to inspect first |
doc_b | 0.72 | At or above | Another candidate to inspect |
doc_c | 0.18 | Below | Defer under this threshold |
Raising the threshold to 0.8 excludes doc_b at 0.72, leaving only doc_a. Relationship scores help select candidates; they do not guarantee factual accuracy.
Fewer Steps Versus Lower Cost
Shortest-path choices depend on whether distance means edge count or total cost. Test the earlier cost example with A–C changed to 400.
The outputs are ['A', 'C'], ['A', 'B', 'C'], and 360. Without a weight, the direct one-step connection wins. weight="cost" sums edge costs to find the cheaper route. Lowering the direct cost to 325 makes the cost-based calls return the direct path and 325 too.
Using similarity directly as cost may favor paths with smaller similarity. The algorithm does not infer whether numbers mean similarity or travel cost; first define what should be minimized.
Direct and Two-Hop Neighbors
Starting from Kim, count distance by the number of edges on a shortest path. Direct neighbors and nodes at shortest distance two are as follows.
| Criterion | Nodes | Interpretation |
|---|---|---|
| Direct neighbors | Lee, Park | Connected directly to Kim |
| Two-hop candidates | Choi | Kim → Park → Choi, shortest distance 2 |
The diagram separates direct and two-hop neighbors of Kim.
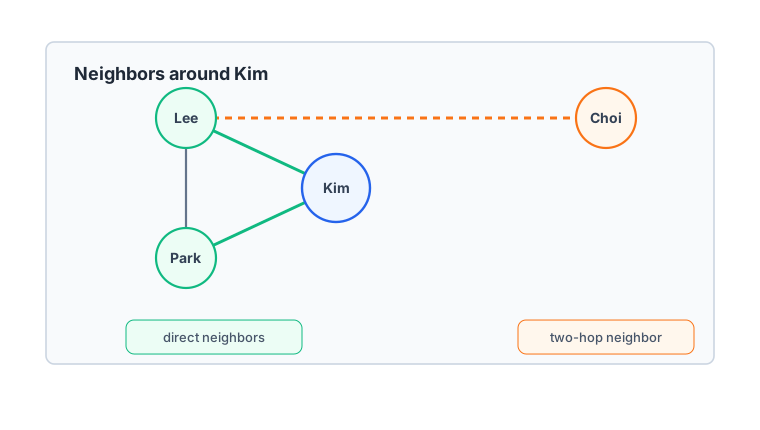
Lee can also be reached by the two-step walk Kim → Park → Lee, but the direct edge makes Lee's shortest distance 1. Lee is therefore excluded from the code's two-hop neighbors.
Relationships in AI
| Situation | Graph perspective |
|---|---|
| Knowledge graph | Concepts, people, places, and events as nodes; relationships as edges |
| Recommender system | User-item and item-item connections |
| Search | Connections among documents, links, keywords, and sources |
| RAG | Relationships among chunks, metadata, sources, and questions |
| Workflow | Connections between tasks and subsequent steps |
Case: Adding One Friendship
Add a direct Kim–Choi connection to the NetworkX example. Insert friend_graph.add_edge("Kim", "Choi", weight=0.6) immediately after friend_graph.add_edges_from(friend_relationships) and rerun.
Kim's direct neighbors become ['Choi', 'Lee', 'Park'], and the two-hop list becomes []: Choi's shortest distance fell from 2 to 1. Strength 0.6 is not used in this step count.
Remove that added line, then remove only the input relationship ("Park", "Choi", {"weight": 0.7}). Choi disappears from the input edges, and because nodes are created from edges, the node list becomes ['Kim', 'Lee', 'Park']. To retain an isolated Choi, explicitly call friend_graph.add_node("Choi") after creating the graph. Choi then exists but is unreachable from Kim.
Moving nodes in a drawing differs from adding or removing edges. If only positions change and connections stay fixed, neighbors and paths remain the same.
Entering the Same Edge Again
nx.Graph() does not stack multiple edges between the same pair of nodes. Calling friend_graph.add_edge("Kim", "Park", weight=0.5) changes that edge's weight from 0.9 to 0.5 without increasing the edge count. To preserve individual clicks or transactions, use event records or a structure supporting multiple edges.
An isolated node differs from an absent node. An explicitly added isolated Choi is absent from Kim's reachable-distance results. This does not mean distance zero: zero denotes the starting node itself, whereas no path is a different state.
Checklist
- Explain graphs as nodes and edges.
- Explain an adjacency list as neighbors stored for each node.
- Explain the different questions highlighted by tables and graphs.
- Explain a tree as a special kind of graph.
- Distinguish undirected and directed graphs.
- Explain weights as numerical information on relationships.
- Represent a small graph with neighbor lists and follow its connections.
- Read how NetworkX handles nodes, edges, neighbors, directions, and weights.
- Recognize when connected data calls for a graph view.
- Distinguish minimum-hop from minimum-cost paths and edge updates from new connections.
Sources and References
- Paul E. Black and Paul J. Tanenbaum, graph, Dictionary of Algorithms and Data Structures, NIST, checked on 2026-07-20. Used as the basis for explaining a graph as a structure made of vertices/nodes and edges/arcs.
- NetworkX Developers, Graph - Undirected graphs with self loops, NetworkX 3.6.1 documentation, checked on 2026-07-20. Used to confirm small undirected graphs, nodes, edges, and adjacency relations.
- NetworkX Developers, DiGraph - Directed graphs with self loops, NetworkX 3.6.1 documentation, checked on 2026-07-20. Used to confirm directed graphs and successor relationships.
- NetworkX Developers, shortest_path, checked on 2026-09-15. Supports the distinction between unweighted and minimum-cost paths.
- NetworkX Developers, Graph.add_edge, checked on 2026-09-15. Confirms that adding an existing edge updates its attributes.