P3-6.2 What Intermediate Representations Can We Add When Features Alone Are Not Enough
Section ID:
P3-6.2Version:v2026.09.19
Features such as averages, slopes, and variability are good starting points. But in some cases, a few numbers alone are not enough to describe the segment-level structure fully. Suppose there is a pattern that rises slowly in the early phase, stays flat in the middle phase, and then drops quickly in the late phase. If that structure is left as only two or three numbers, it can feel insufficient both when a person reads it again and when a model compares it. So in Part 3, intermediate representation is read together as a human-led input re-expression that remains between raw logs and summary features so the structure can stay more visible.
This section does not repeat feature design itself again. Instead, it focuses on how far we can go in adding intermediate representations such as segment expressions and tokenization when numerical features from the previous section alone do not preserve enough structure.
This is where segment expressions and tokenized expressions appear. The core idea is simple. Instead of staring at the long raw curve as it is, we divide the whole thing into a few ranges and convert the direction and strength of each range into short symbols or short summary values.
| Segment | Numerical summary | Example of symbolic summary |
|---|---|---|
| Early phase | Average rate of rise is positive | UP |
| Middle phase | Average change is almost zero | FLAT |
| Late phase | Rate of decline is large | DOWN |
If we divide the raw curve into segments as in the graph below, tokenization becomes visible not as simply naming things, but as turning the curve's direction and strength into shorter reading units.
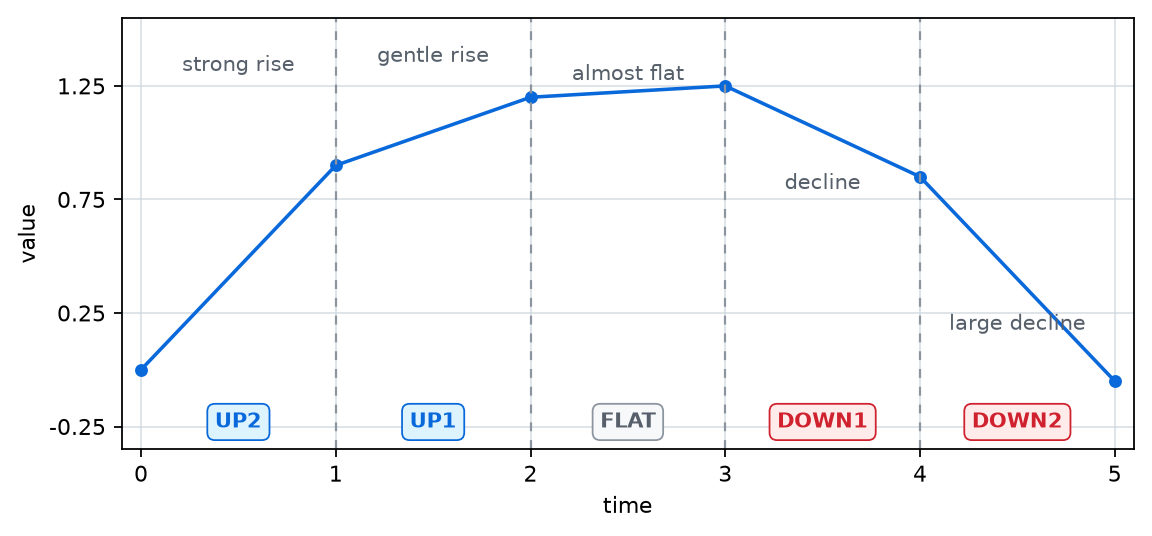
This illustrative curve accumulates event A slopes from the CSV. The horizontal axis is segment-boundary index, not actual time; the calculation is explained below.
Once this is done, a long curve shrinks into a short sequence such as UP, FLAT, DOWN. This expression is easy for people to read, and matching segment counts separately can also give a model equal token counts. In other words, a segment expression is the act of converting a complex time series into an intermediate representation that people and models can both look at.
This representation can also be read in three levels. At the simplest level, it leaves only direction, such as UP, DOWN, FLAT. At a slightly finer level, it also leaves intensity, such as UP1, UP2, DOWN3. Going further, we can also inspect how many times each symbol repeated and in which ranges it stayed for long. Seen this way, tokenization is not a simple substitution. It is a way of rewriting the same raw curve at several resolutions.
| Representation level | What remains | What is easy to lose | When it is useful |
|---|---|---|---|
| Keep only direction | Rise, fall, flatness | Differences in the magnitude of change | When a very fast comparison is needed |
| Direction + intensity | Strength of rise or fall | Fine-grained fluctuation shape | When we want more explainable features |
| Include repetition length | Number of consecutive segments with the same token | Fine changes in the original time spacing | When we want to inspect repetition and state shifts |
This table shows that tokenization becomes easier to read the more strongly it compresses, but at the same time it also loses more. So which level to use is not a matter of technical taste. It is part of the problem definition. The level of representation that should remain can differ depending on whether we want a report that an operator can scan quickly or a structure that may later be reused as model input.
If we split once more the question why do we need this representation, the role of segment expressions between the summary table and the raw log becomes clearer.
| What we already have | Why we convert more | What becomes visible right after conversion |
|---|---|---|
| A few segment averages | We want to see order and direction in a shorter way | A pattern like UP, FLAT, DOWN |
| One overall average | We want to reveal structural differences that the average hides | Same average, different shape |
| The full raw log | We need an intermediate representation a person can compare quickly | The outline of repeating structures |
The code below reads a segment-slope CSV and changes the token boundaries in two settings, showing how the same raw slopes can turn into different token sequences.
Problem situation: check what becomes easier to see when continuous numerical slopes are converted into a short symbol sequence.
Input: the segment-slope CSV by action, p3_6_2_segment_slopes.csv, and the token-boundary candidates token_settings
Expected output: output where each action's slope list is turned into a token sequence such as UP2, UP1, FLAT, DOWN1, DOWN2. If the boundaries change, the number of segments left as FLAT, the number of strong rise/fall tokens, and the list of changed actions also change.
Concept to check: tokenization does not leave the raw structure as-is. It turns sequence and direction into an easier-to-read intermediate representation. Token boundaries are not fixed answers; they are design values that should be checked against the problem.
Define Slope Units and Token Boundaries First
This CSV contains fictional slope data. To interpret its existing values, which lack unit metadata, this example defines arbitrary value units and segment-boundary indices on the horizontal axis. Slope is (end value−start value)/(end index−start index), in value units per index interval, not per second. A start value of 0 and end value of 0.92 across indices 0→1 give 0.92/1=0.92. The CSV contains only the resulting slopes; it cannot recover raw measurements or actual times.
The figure uses straight segments constructed by accumulating A's slopes. Starting at 0 and adding 0.92, 0.31, 0.05, −0.42, and −1.00 gives boundary values 0, 0.92, 1.23, 1.28, 0.86, and −0.14. It is an illustration, not a reconstruction of a measured raw curve or within-segment fluctuations.
The sensitive setting uses weak boundary w=0.20 and strong boundary s=0.80. The conditions below apply to slope x and assume 0 < w < s. Weak and strong are categories in this design, not universal physical standards.
| Token | Condition | Sensitive range |
|---|---|---|
| UP2 | x ≥ s | x ≥ 0.80 |
| UP1 | w ≤ x < s | 0.20 ≤ x < 0.80 |
| FLAT | −w < x < w | −0.20 < x < 0.20 |
| DOWN1 | −s < x ≤ −w | −0.80 < x ≤ −0.20 |
| DOWN2 | x ≤ −s | x ≤ −0.80 |
Classifying A's values 0.92, 0.31, 0.05, −0.42, and −1.00 gives UP2, UP1, FLAT, DOWN1, DOWN2. Exactly 0.20 becomes UP1, −0.20 becomes DOWN1, 0.80 becomes UP2, and −0.80 becomes DOWN2. FLAT is a range inside the boundaries, not exactly zero. Values 0.05 and −0.10 both become FLAT, losing the direction and size of small changes. A small endpoint difference can also hide large fluctuations inside a segment.
The conservative setting uses w=0.30 and s=0.90. B's 0.24 and −0.22 change from UP1 and DOWN1 to FLAT, while their numeric values stay unchanged. All five A values retain their tokens. The classification rule changes, not the event itself.
Token Count and Elapsed Time Are Separate Choices
Tokenization maps one segment to one token; it does not equalize segment counts. This CSV produces five tokens per event because it already contains five segments per event. Three segments would produce three tokens. A fixed input length requires separate segmentation, cropping, or padding rules.
FLAT FLAT means two consecutive segments. Two one-second segments last two seconds; two ten-second segments last twenty seconds. Without actual segment durations, repetition counts cannot determine elapsed time. Retain slopes, segment boundaries, actual times, and threshold settings alongside tokens to check lost details against source records.
Expected output:
The key point to watch in this output is not only the moment when continuous numbers turn into a short symbol sequence, but also which actions actually change interpretation when the boundaries change. The values to manipulate here are strong_threshold and weak_threshold inside token_settings. In the conservative setting, more small changes remain FLAT, and the token sequences change for actions near the boundary, such as B, D, E, F, and H. By contrast, an action like A, where the strong rise and strong fall are clear, keeps its main structure even when the setting changes.
When several actions are viewed together, it becomes clearer that a token rule is not a simple label but a design judgment. People can now read the structure quickly as rise, gentle rise, almost flat, decline, large decline, but they can also re-check which threshold folded which segment into FLAT.
If this example is checked in the following order, the role of tokenization becomes clearer.
- Check into which token each slope was converted.
- Think about whether the token boundaries are too coarse or too dense.
- Write how a person would read this token sequence in one sentence.
For example, ['UP2', 'UP1', 'FLAT', 'DOWN1', 'DOWN2'] can be summarized as the early rise is strong, the middle flattens for a while, and the late decline becomes larger.
It is also important that the token sequence can differ even when the average is the same. For example, even if the average flow of two actions is 2.5 in both cases, one may be UP, FLAT, DOWN while the other is FLAT, FLAT, FLAT. They look similar if we inspect only the average, but the token sequence reveals that one had structural change while the other remained stable. Because of this, tokenization is not mere decoration. It is a representation that complements structure missed by average-based summaries.
We can also check this difference with a small vectorization example. The code below compares a ranking based only on the numerical average with a ranking that vectorizes the token sequence using TfidfVectorizer and sorts candidates by similarity to a query.
The output looks like this.
Using numerical means alone, A and B are equally close candidates. Yet every segment of B is flat, so it lacks the query's rise–flat–fall structure. Vectorizing the token sequences instead places A closest, followed by C, which shares some rising and falling structure. This does not mean TfidfVectorizer is the correct answer. It shows that converting human-defined segment tokens into real library inputs lets us compare direction tokens and adjacent token pairs whose differences disappeared in the mean summary.
Here, ngram_range=(1, 2) counts individual tokens and adjacent token pairs. With (1, 1), A and its reversed sequence D have identical token counts and cannot be distinguished. Even token pairs do not preserve the entire order or absolute timing. For example, UP FLAT UP DOWN UP and UP DOWN UP FLAT UP have different orders but identical counts of single tokens and adjacent pairs. Retaining a token sequence and converting it into a frequency vector are two stages with different information losses.
This matters because segment tokens are still human-defined expressions, yet they already have the property of being a sequence with order. So they can preserve structure more directly when numerical features alone might miss it, and they also let us carry the same input structure forward naturally when sequential data or representation learning is explained later.
But this clearly has limits too. The moment we convert a curve into symbols, information loss appears, and the choice of where to place the boundaries for UP, DOWN, and FLAT also reflects the designer's judgment. In other words, tokenization is not universal. It is a compression that gains explainability while throwing away some detail.
So it is safer to understand this expression not as something that replaces the raw log, but as an intermediate representation placed between the raw log and the summary table. The raw log has the most information, the summary table is advantageous for comparison, and the tokenized expression makes structure more visible in the middle. Once we understand this relationship, it also becomes clearer why some problems need more than an average and why some problems do not require us to inspect the entire raw log every time.
So when reading a tokenized representation, we should always carry two questions together. What becomes easier to see because of this representation? and What was lost by turning it into this representation? Only with this sense of balance do we stop seeing a token sequence as a mysterious code and start reading it as an intermediate representation built for a purpose.
The same judgment can be summarized more briefly like this.
| What we need right now | The more direct representation |
|---|---|
| Numerical comparison and simple model input | Numerical features |
| Fast reading of segment order and direction | Segment expressions |
| Comparing structure as a short symbol sequence | Tokenized expressions |
So numerical features and intermediate representations are not in competition. They are tools separated according to what we want to make more visible.
This section can be read not as an introduction to one particular token rule, but as the problem of what intermediate representation should be placed between raw structure and summarized features.
Converting Segment Summaries into Token Sequences
The core of this section is that we do not immediately discard the raw curve or close it too quickly into a few numbers. Once the curve is segmented and turned through numerical summaries into a token sequence, one more layer appears: the intermediate representation.
flowchart TD
    R[Raw curve]
    G[Segment it]
    N[Numeric summaries]
    T[Token sequence]
    I[Intermediate representation]

    R --> G --> N --> T --> I
So tokenization is more accurately read not as an isolated technique, but as a choice about at what resolution the structure should remain between leaving the raw log as it is and summarizing it too strongly.
Checklist
- Did you use the example to check what information unigrams and bigrams preserve?
- Can you explain how sequences can differ despite identical token and adjacent-pair frequencies?
Sources and Further Reading
- TensorFlow,
Subword tokenizers. Because it explains subword tokenizers as a representation between word-based tokenization and character-based tokenization, it can help explain the generalized view that Part 3's segment tokens also sit as an intermediate representation between raw logs and strong summaries. The part that connects this directly to time-series tokenization is an analogical application based on the official explanation. https://www.tensorflow.org/text/guide/subwords_tokenizer / Accessed: 2026-07-20 -
Google for Developers,
Machine Learning Glossary:feature engineering. Because it explains feature engineering as the process of deciding transformations helpful for model training, it supports the point that intermediate representations are also transformations that do not leave raw values untouched but convert them into forms helpful for comparison and learning. https://developers.google.com/machine-learning/glossary / Accessed: 2026-07-20 -
scikit-learn Feature extraction. Checked the local order information preserved by word frequencies and n-grams. Checked: 2026-09-15.