P5-3.2 Sigmoid
Section ID:
P5-3.2Version:v2026.07.26
In P5-3.1, we saw that an activation function changes the weighted-sum score \(z\) into the value \(a\) passed to the next layer. Now we look at one representative function at a time and check how the same score can turn into a different kind of signal.
The sigmoid is an activation function that compresses the input score \(z\) into a value between 0 and 1. Large negative values move close to 0, large positive values move close to 1, and values near 0 change relatively quickly.
If the baseline for representative activation functions is needed again, return to the activation function and sigmoid entries in the concept glossary.
The Question of How Sigmoid Compresses Values
- What formula and output range does the sigmoid have?
- Why is it read as a value between 0 and 1?
- In what kinds of scenes is the sigmoid intuitively useful?
- What must be handled carefully when the sigmoid is read like a probability?
This section does not spend a long time comparing the formulas of the sigmoid and the other representative functions. Tanh is handled separately in P5-3.3, ReLU in P5-3.4, and the formula comparison of all three functions is organized in P5-3.5. The interpretation of the sigmoid in the output layer reconnects in P5-3.6 and P5-4.2.
Standards for the S-Curve and Saturation
- You can explain the sigmoid as
a function that compresses values into the range between 0 and 1. - You can explain intuitively why the output approaches 1 as the input \(z\) grows larger.
- You can explain saturation, where changes become dull at large positive and large negative values.
- You can distinguish sigmoid output from an operational policy threshold.
The Formula of the Sigmoid
The sigmoid is usually written with the following formula.
Here, \(e^{-z}\) makes the denominator larger or smaller depending on the sign and size of the input \(z\).
- If \(z\) is a large positive value, \(e^{-z}\) becomes close to 0, so the output becomes close to 1.
- If \(z=0\), then \(e^0=1\), so the output is \(1/(1+1)=0.5\).
- If \(z\) is a large negative value, \(e^{-z}\) becomes very large, so the output becomes close to 0.
In other words, the sigmoid places every input between 0 and 1.
How Should the Graph Be Read
The sigmoid graph has an S-shape. What matters is not the name of the shape, but how it reacts by range.
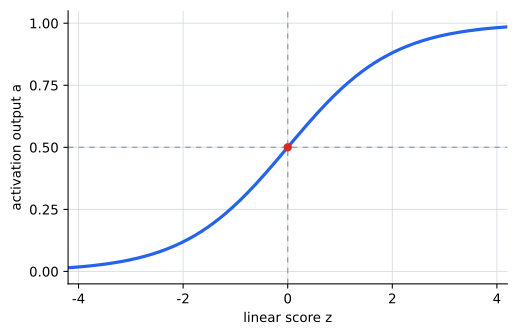
| Input range | Feel of the output | What the reader should read first |
|---|---|---|
| Large negative values | Close to 0 | It is compressed into a strong negative-side signal. |
| Near 0 | Around 0.5 | Small score differences still show up relatively clearly. |
| Large positive values | Close to 1 | It is a strong positive-side signal, but even if it grows more, the change becomes dull. |
Because of this property, the sigmoid often appears in binary-classification output. Since the value lies between 0 and 1, it is easy to read how far it leans toward the positive side.
However, a sigmoid output does not automatically guarantee a well-calibrated probability. If the output value is used for operational decisions, the threshold, the data distribution, and the evaluation criterion must be examined together.
Cases and Examples
Suppose an equipment-alarm model created the score \(z\) for a signal leaning toward immediate shutdown on some frame. The operational policy says that if the sigmoid output is 0.7 or higher, raise it as a shutdown candidate.
| Scene | \(z\) | Intuition of the sigmoid output | Judgment under threshold 0.7 |
|---|---|---|---|
| Stably recovered scene | \(-2\) | It is compressed into a value close to 0, so the shutdown-side signal becomes weak. | It is not raised as a shutdown candidate. |
| Ambiguous boundary scene | \(0\) | It stays near 0.5, so it does not lean strongly either way. | It is not yet raised as a shutdown candidate. |
| Scene requiring caution | \(1\) | It becomes a value slightly above 0.7 and leans toward the positive side. | It is raised as a shutdown candidate. |
| Strong alarm scene | \(3\) | It moves close to 1, so the shutdown-side signal looks strong. | It is raised as a shutdown candidate. |
What must be read first in this table is that sigmoid output and operational judgment are not the same thing. For example, \(z=1\) and \(z=3\) are both on the positive side, but one is a scene that barely crossed the threshold, while the other is a scene already very close to 1. The sigmoid changes the score into a signal between 0 and 1, and the threshold is a separate standard that decides where to turn that signal into action.
The other important point is saturation. People can easily expect that because z=3 is much larger than z=1, the output difference should also keep spreading. But the sigmoid approaches 1 in the high range and compresses the difference. So the direction it leans toward the positive side remains clear, but the detailed difference among large positive values can survive less strongly.
The result to confirm in this case is that the sigmoid changes the score into an easy-to-read value between 0 and 1, the threshold rereads that value as an action standard, and the change becomes dull at large positive and large negative values.
Practice and Exercise
Suppose the following scores are passed through the sigmoid. Keep the operational policy as 0.7 or higher means shutdown candidate.
| \(z\) | Output range to predict first | Question to check first |
|---|---|---|
| \(-4\) | Very close to 0 | How strongly is it compressed toward the negative side? |
| \(0\) | 0.5 | Why does this become the boundary reference point? |
| \(1\) | Slightly above 0.7 | Does it barely cross the threshold? |
| \(4\) | Very close to 1 | Has it already entered the saturation range? |
| \(8\) | Even closer to 1 | Compared with \(4\), how much difference still remains? |
When reading this table, the following two questions must be closed directly.
- Does \(z=1\) show both
it leans toward the positive sideandit actually crossed the action thresholdat the same time? - If \(z=4\) is raised to \(z=8\), the output still grows, but why does the difference not spread as much as it does when going from \(z=0\) to \(z=1\)?
The direction of the answer is clear. Around \(z=1\), the sigmoid still changes actively enough to affect threshold judgment directly, but in large positive ranges such as \(z=4\) and \(z=8\), both are already close to 1 and the difference is compressed strongly. So when reading the sigmoid, you should separate which side the output leans toward, whether it crosses the threshold, and whether it has already entered the saturation range.
Checklist
- Can you read the sigmoid formula \(\sigma(z)=1/(1+e^{-z})\)?
- Can you explain why the output becomes 0.5 when \(z=0\)?
- Can you explain that large negative values move toward 0 and large positive values move toward 1?
- Can you distinguish sigmoid output from an actual operational threshold?
- Do you understand that the sigmoid connects to the formula comparison in P5-3.5 and to output-layer interpretation in P5-3.6?
Sources and References
- Ian Goodfellow, Yoshua Bengio, Aaron Courville,
Deep Learning, MIT Press, 2016, date checked: 2026-06-29. https://www.deeplearningbook.org/ - Christopher M. Bishop,
Pattern Recognition and Machine Learning, Springer, 2006, date checked: 2026-07-19. https://link.springer.com/book/9780387310732